About the ARPEDIO Score Trending Component
The Score Trending component displays the evolution of assessment and relationship scores over time for a specific account or opportunity. It is available in the Matrix package and can pull data from both the ARPEDIO Matrix and Sales packages depending on what is installed in your org.
Matrix Package Setup
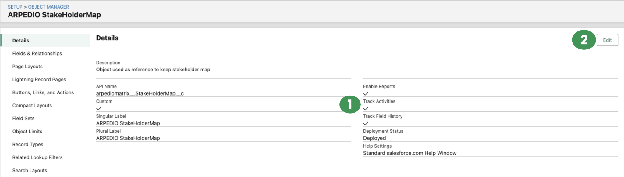
1. Activate Field History Tracking on the ARPEDIO StakeholderMap Object
- In Setup, open the Object Manager and search for ARPEDIO StakeholderMap.
- In the object details, check whether Track Field History is already activated.
If not, click Edit, activate Track Field History, and click Save.
2. Enable Score Field History Tracking on the StakeholderMap Object
- Within the ARPEDIO StakeholderMap object, go to Fields & Relationships.
- Click Set History Tracking.
- Ensure the Score field is checked. If not, select it and click Save.
Once complete, every change to the relationship score in the Matrix will be tracked in the Score Trending component.
Note: If you only have the ARPEDIO Matrix package installed, skip ahead to Step 5.
Sales Package Setup
3. Activate Field History Tracking on the ARPEDIO Assessment Object
- In Setup, open the Object Manager and search for ARPEDIO Assessment.
- In the object details, check whether Track Field History is already activated.
- If not, click Edit, activate Track Field History, and click Save.
4. Enable Score Field History Tracking on the ARPEDIO Assessment Object
- Within the ARPEDIO Assessment object, go to Fields & Relationships.
- Click Set History Tracking.
- Ensure the Overall Score field is checked. If not, select it and click Save.
Once complete, every change to the assessment score will be tracked in the Score Trending component.
Adding the Component to a Lightning Page
5. Add the arpedioScoreTrending Component
- Decide whether to add the component to an Account or Opportunity Lightning page, then open that page in Lightning App Builder.
- In the left component panel, search for arpedioScoreTrending.
- Drag and drop the component onto the page.
- Click Save.
Note: For the best experience, place the component in a wider section of the page layout.
Using the Score Trending Component
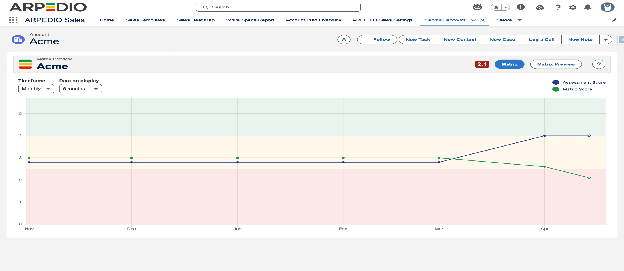
The component begins tracking scores from the point of setup. Data will appear after two days of score tracking.
You can view score trends in daily, weekly, or monthly frequency. Weekly and monthly views display the average score for the selected period. Hovering over any point on the chart reveals the score details for that point in time.